


Logging is one of the three pillars of observability in distributed systems. As such, we have seen an explosion of popular open-source (e.g. ELK stack) and mature commerical products (e.g. Splunk) to deal with logging at scale. However, in a complex system like Kubernetes, logging remains a hard problem, compounded by the continued growth of data driven by increased adoption of containerized system.
In this post, we will look into the different types of Kubernetes logs needed for better observability, as well as approaches to collect, aggregate, and analyze those logs in Kubernetes. We will then introduce an open-source solution using fluentd and fluentbit to make logging easier.
Types of Kubernetes Logs
Application Logs
First and foremost, we're interested in our application logs to debug problems or simply monitor application activity. All container engines (e.g. Docker, containerd, cri-o) support some kind of logging mechanism such as stdout/stderr or writing to a file.
We can group logs from Kubernetes tools like ingress controllers, cluster autoscalers, or cert-manager under this category as well.
Kubernetes Component Logs
Besides the application it orchestrates, Kubernetes also emits logs from its componenets such as etcd, kube-apiserver, kube-scheduler, kube-proxy, and kubelet. If the node supports systemd, kubelet and container runtimes write to journald. Otherwise, system components write .log files under /var/log directory of the node.
Kubernetes Events
Every Kubernetes event (e.g. scheduling a pod, deleting a pod) is a Kubernetes API object recorded by the API server. These logs include important information about changes to Kubernetes resource state.
Kubernetes Audit Logs
Kubernetes also provides audit logs for each request to the API server when enabled. Each request is associated with a predefined stage: RequestReceived, ResponseStarted, ResponseComplete, and Panic and generates an audit event. That event is then processed accordingly to the audit policy, which details the audit levels including None, Metadata, Request, and RequestResponse
Kubernetes Logging Approaches
Generally, there are two major ways to handle logs in Kubernetes:
- Logging to stdout/stderr and using a logging agent to aggregate/forward to an external system
- Using a sidecar to send logs to an external system
With the first case, kubelet is responsible for writing the container logs to /var/log/containers on the underlying node. Note that Kubernetes does not provide a built-in mechanism for rotating logs, but logs files are evicted from the node when the container is evicted from it. A logging agent is then responsible for collecting these logs and sending it to an aggregator like Splunk, Sumo Logic, and ELK.
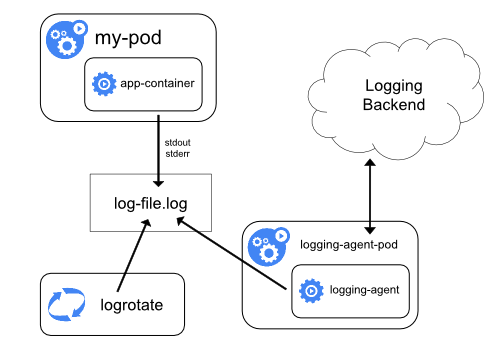
Image Credit: https://kubernetes.io/docs/concepts/cluster-administration/logging/
Alternatively, a sidecar container can be deployed alongside the application to pick up logs from the application. This sidecar can read from a stream, a file, a socket, or journald and send to a log aggregating tool for further analysis and storage.
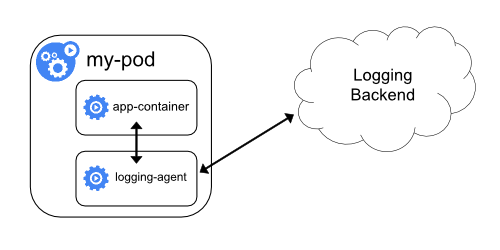
Image Credit: https://kubernetes.io/docs/concepts/cluster-administration/logging/
Finally, application code can be reconfigured to push logs directly to some logging backend, but this pattern is not common as it alters code behavior.
Kubernetes Logging Tools
Because Kubernetes does not provide log aggregation capabilities by default, log agents are often deployed at a cluster level to collect, aggregate, and send logs to a central backend.
Fluentd & Fluent Bit
Both Fluentd and Fluent Bit are production-grade log aggregator and forwarder, hosted by the Cloud Native Computing Foundation (CNCF). Fluentd was the original project aimed at solving log aggregation and forwarding at scale, and then Fluent Bit was added later as a lightweight version of Fluentd with similar goals. Each project can be used standalone in either aggregator or forwarder roles. It is also possible to combine both deployments as we will see later in the Fluent Operator model.
ELK/EFK
Another popular open-source tool is the ELK (Elasticsearch, Logstash, and Kibana) stack:
- Elasticsearch: indexes log files for analysis
- Kibana: visualization tool
- Logstash: log aggregator
- Beats: log forwarder
Sometimes Logstash/Beats is replaced with either Fluentd or Fluent Bit to create EFK stack as well.
Stackdriver / CloudWatch
When running on public cloud (e.g. GKE, EKS), it is possible to also leverage each provider's native log solution. GKE comes with Stackdriver support by default. On EKS, fluentd daemonset is deployed, configured to pass logs to Cloudwatch.
Commercial Options
Finally, there are established commercial tools from Splunk, Sumo Logic, Datadog, and more, each with custom logging agents.
Introduction to Fluent Operator
Fluent Bit Operator (to be renamed to Fluent Operator) is a Kubernetes logging operator developed by the KubeSphere team and donated to the upstream fluent community. Fluent Operator combines the advantages of fluentbit (lightweight) and fluentd (rich plugin ecosystem) to collect logs from each node via fluentbit daemonset, which then forwards to fluentd for aggregation and forwarding to its sinks such as elasticsearch, kafka, loki, s3, splunk, or other log analysis tool.
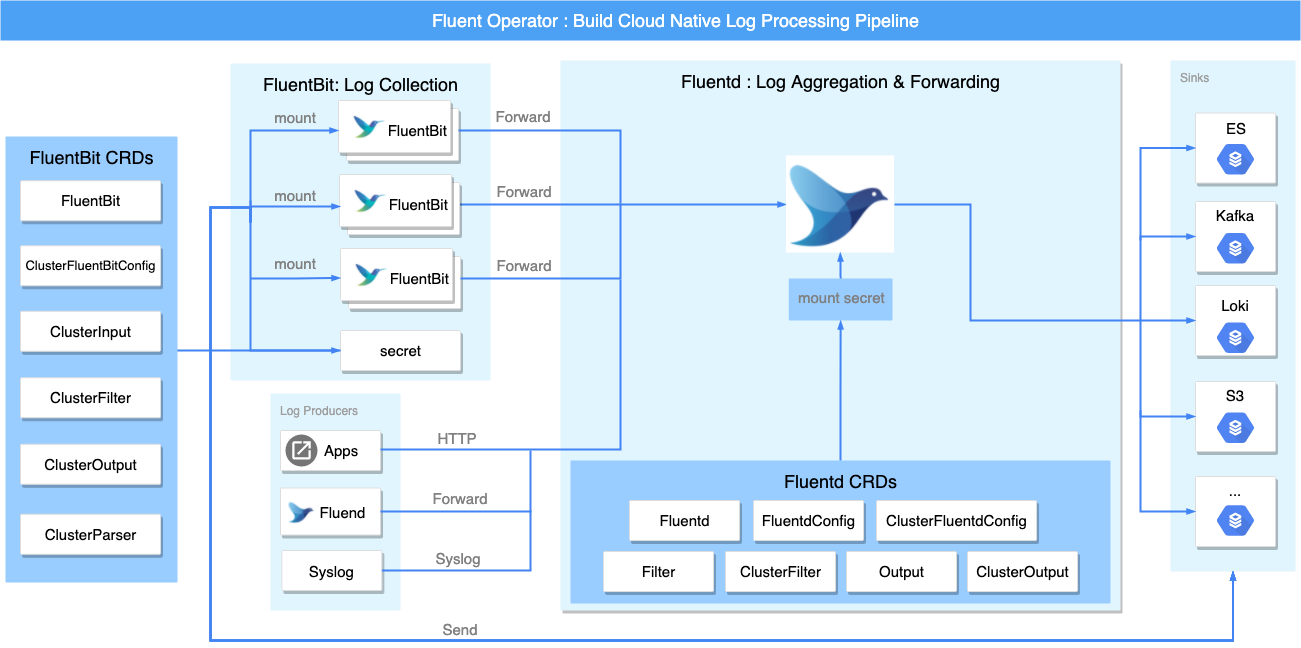
Fluent Operator is comprised of five custom resourses:
- FluentBit: Defines the Fluent Bit DaemonSet and its configs.
- FluentBitConfig: Defines the input/filter/output plugins and generates the final config into a Secret.
- Input: Defines the input config sections.
- Parser: Defines the parser config sections.
- Filter: Defines the filter config sections.
- Output: Defines the output config sections.
Using the operator has several advantages to managing each of these components separately:
- KubeSphere's custom Fluent Bit image supports dynamic reloading of configuration without rebooting Fluent Bit pods.
- The wiring between Fluent Bit and Fluentd is managed by human-friendly input and output CRDs instead of config files within each component.
- It's easier to select input/filter/output plugins via Kubernetes labels
Processing Kubernetes Logs in KubeSphere
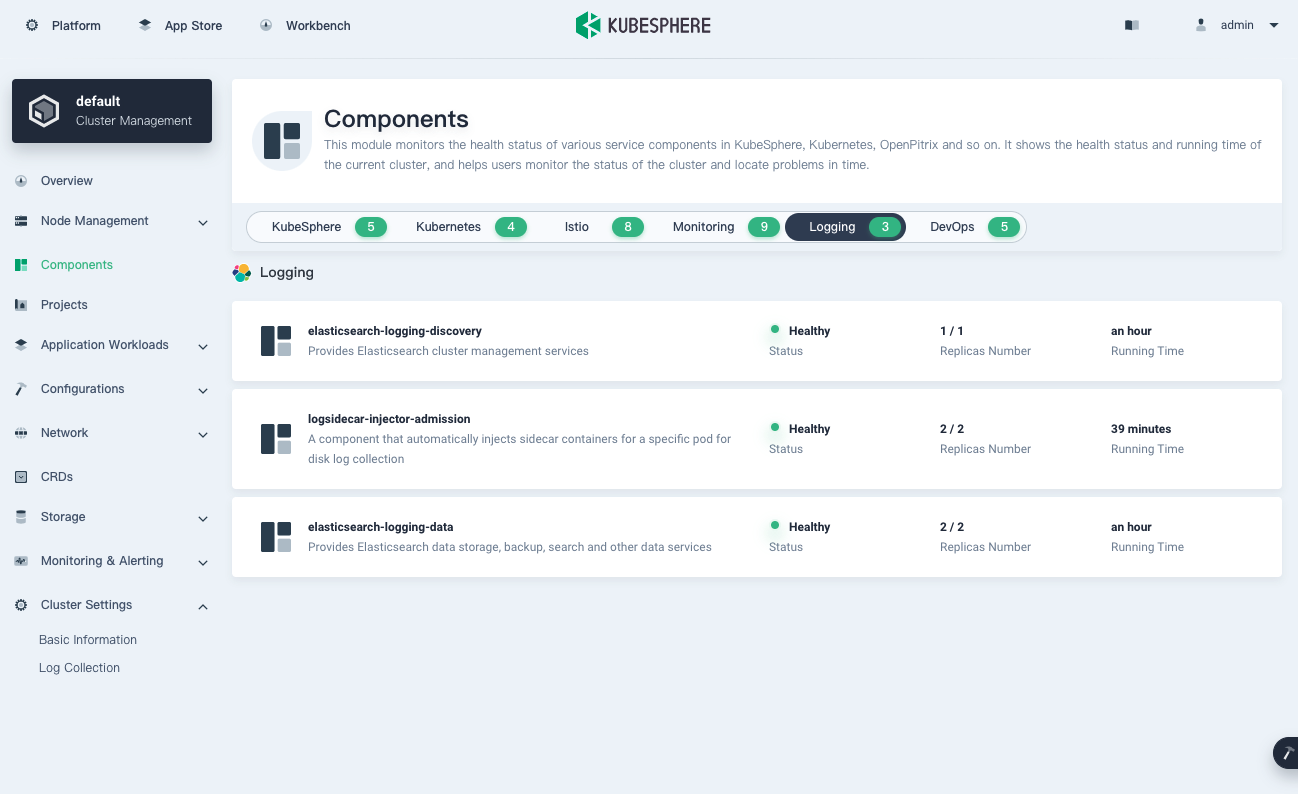
KubeSphere uses the Fluent Operator underneath the hood to collect and process Kubernetes logs. To enable logging, simply set the logging field to true:
logging:
  enabled: true
Then on the dashboard, you should be able to verify logging components:
To collect Kubernetes events, set the events field to true
events:
  enabled: true
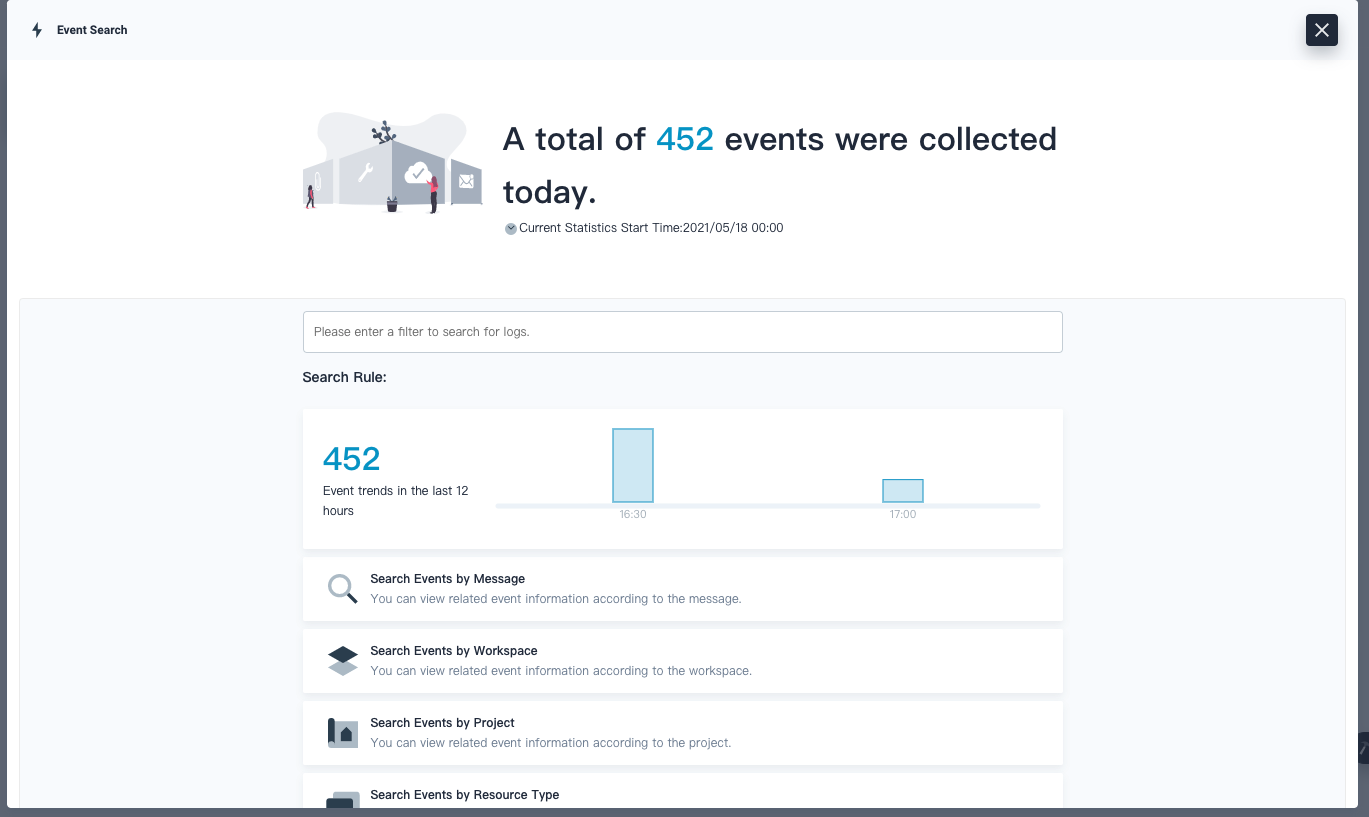
Then you can use the Event Search function from the Toolbox to search event logs:
Likewise for audit logs, set the auditing field to true
auditing:
  enabled: true
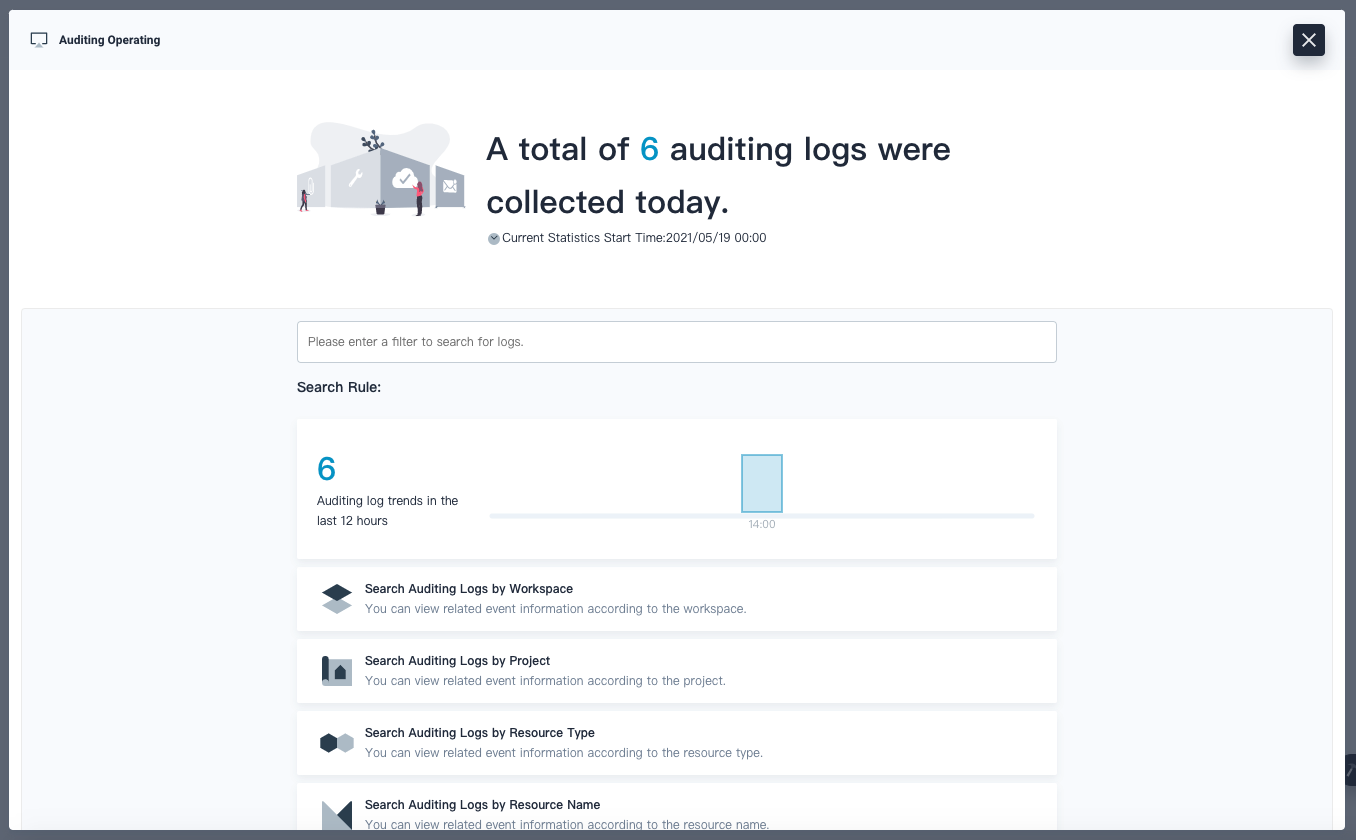
Then you can use the Auditing Operating function from the Toolbox:
Conclusion
From application logs to audit logs, there are multiple sources of logs that one must collect and analyze in Kubernetes. In this article, we looked at common logging patterns (i.e. stdout, sidecar) as well as popular tools to collect and aggregate those logs. Finally, we also saw how the Fluent Operator is used in KubeSphere to simplify the setup process.
Implementing a proper logging infrastructure at scale is not an easy process. Utilize the native integration with Fluent Operator in KubeSphere to focus on the key insights that your logs surface, rather than reinventing the wheel on a hard problem.
