Introduction to Kubernetes Control Plane
In a Kubernetes cluster, there are two machines roles including master nodes and worker nodes. The master node runs the Kubernetes control plane, which is responsible for the management of the worker nodes, makes scheduling decisions, and implements changes to drive the cluster to a desired state. The worker nodes, as the name implies, they run the workloads and Pod on them.
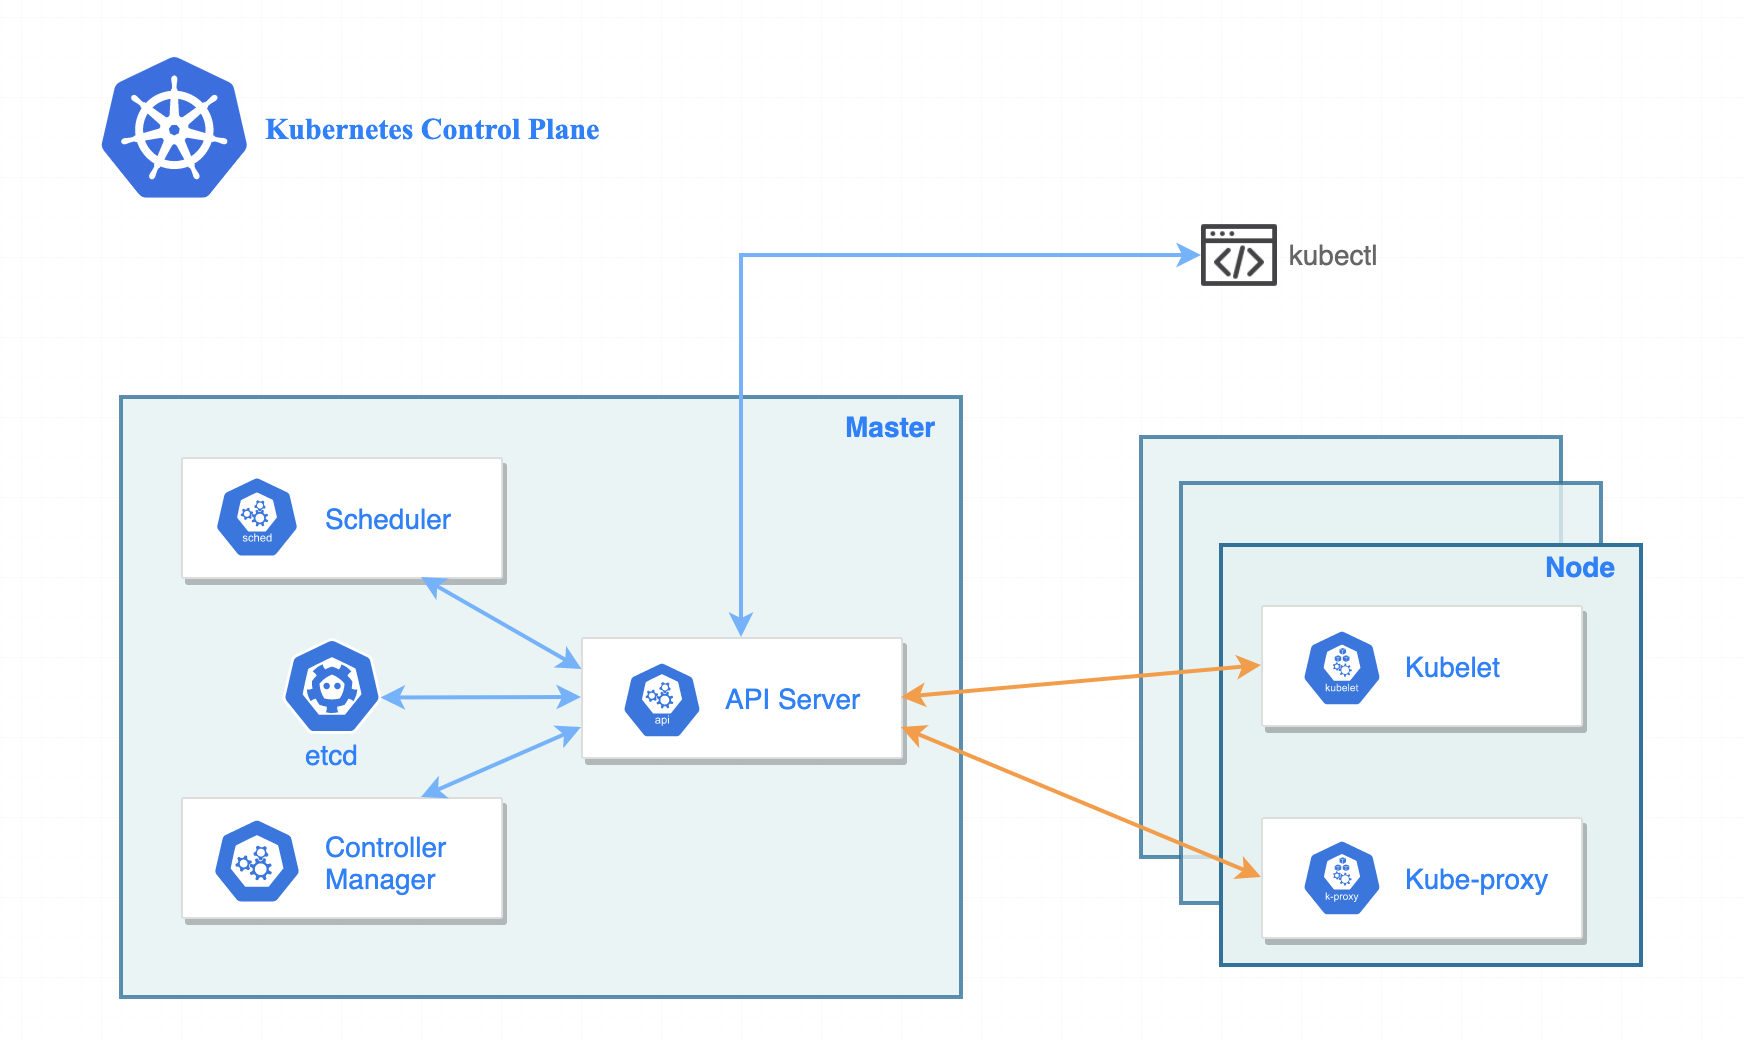
As is shown in the graph, there are four components running in the Kubernetes control plane, each of them is critical for running a healthy Kubernetes cluster, they act as the different roles within the cluster:
- kube-apiserver: a component of the Kubernetes control plane that exposes the Kubernetes API. The API server is the front end for the Kubernetes control plane.
- etcd: Consistent and highly-available key value store used as Kubernetes’ backing store for all cluster data.
- kube-scheduler: watches for newly created Pods with no assigned node, and selects a node for them to run on.
- kube-controller-manager: watches the state of the cluster through API server watch feature and makes changes to move cluster towards the desired state.
Why Monitoring Control Plane
To keep high reliability of the Kubernetes cluster, monitoring the components of the control plane allows cluster administrator to more rapidly diagnose the scheduling and orchestration issues that occur in the cluster. Thus, we need to collect the metrics of control plane to visualize the real-time data, and digs deeper into the state and performance of each control plane component.
Tools to Control Plane Monitoring
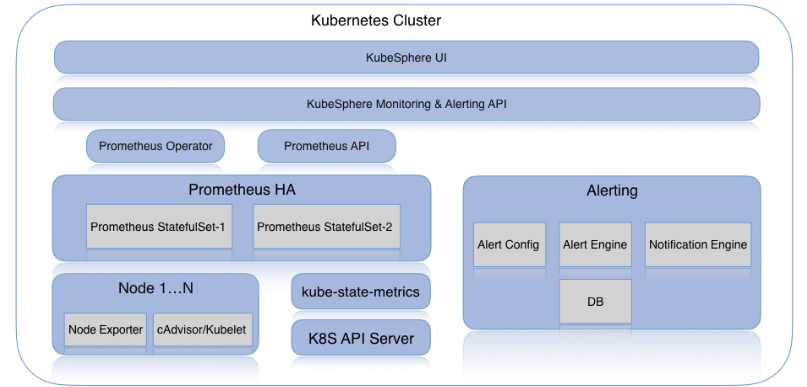
There is no denying that Prometheus a leading open-source monitoring solution. Plus Grafana dashboard, it could be a perfect tools combination solution to monitor the Kubernetes control plane component. But both of them are a little bit complicated to quickly set up and collect the target metrics into a unified monitoring dashboard.
Fortunately, KubeSphere leverages those tools including Prometheus, Kube-state-metrics Node-exporter, ServiceMonitor, as well as the predefined rules in PrometheusRule, providing the monitoring metrics from application to infrastructure out of box.
Metrics in KubeSphere
To effectively monitor the control plane components, visibility of each component health and state is critical. You can install KubeSphere to easily get the whole insight of the control plane components monitoring, and displays the time-series data.
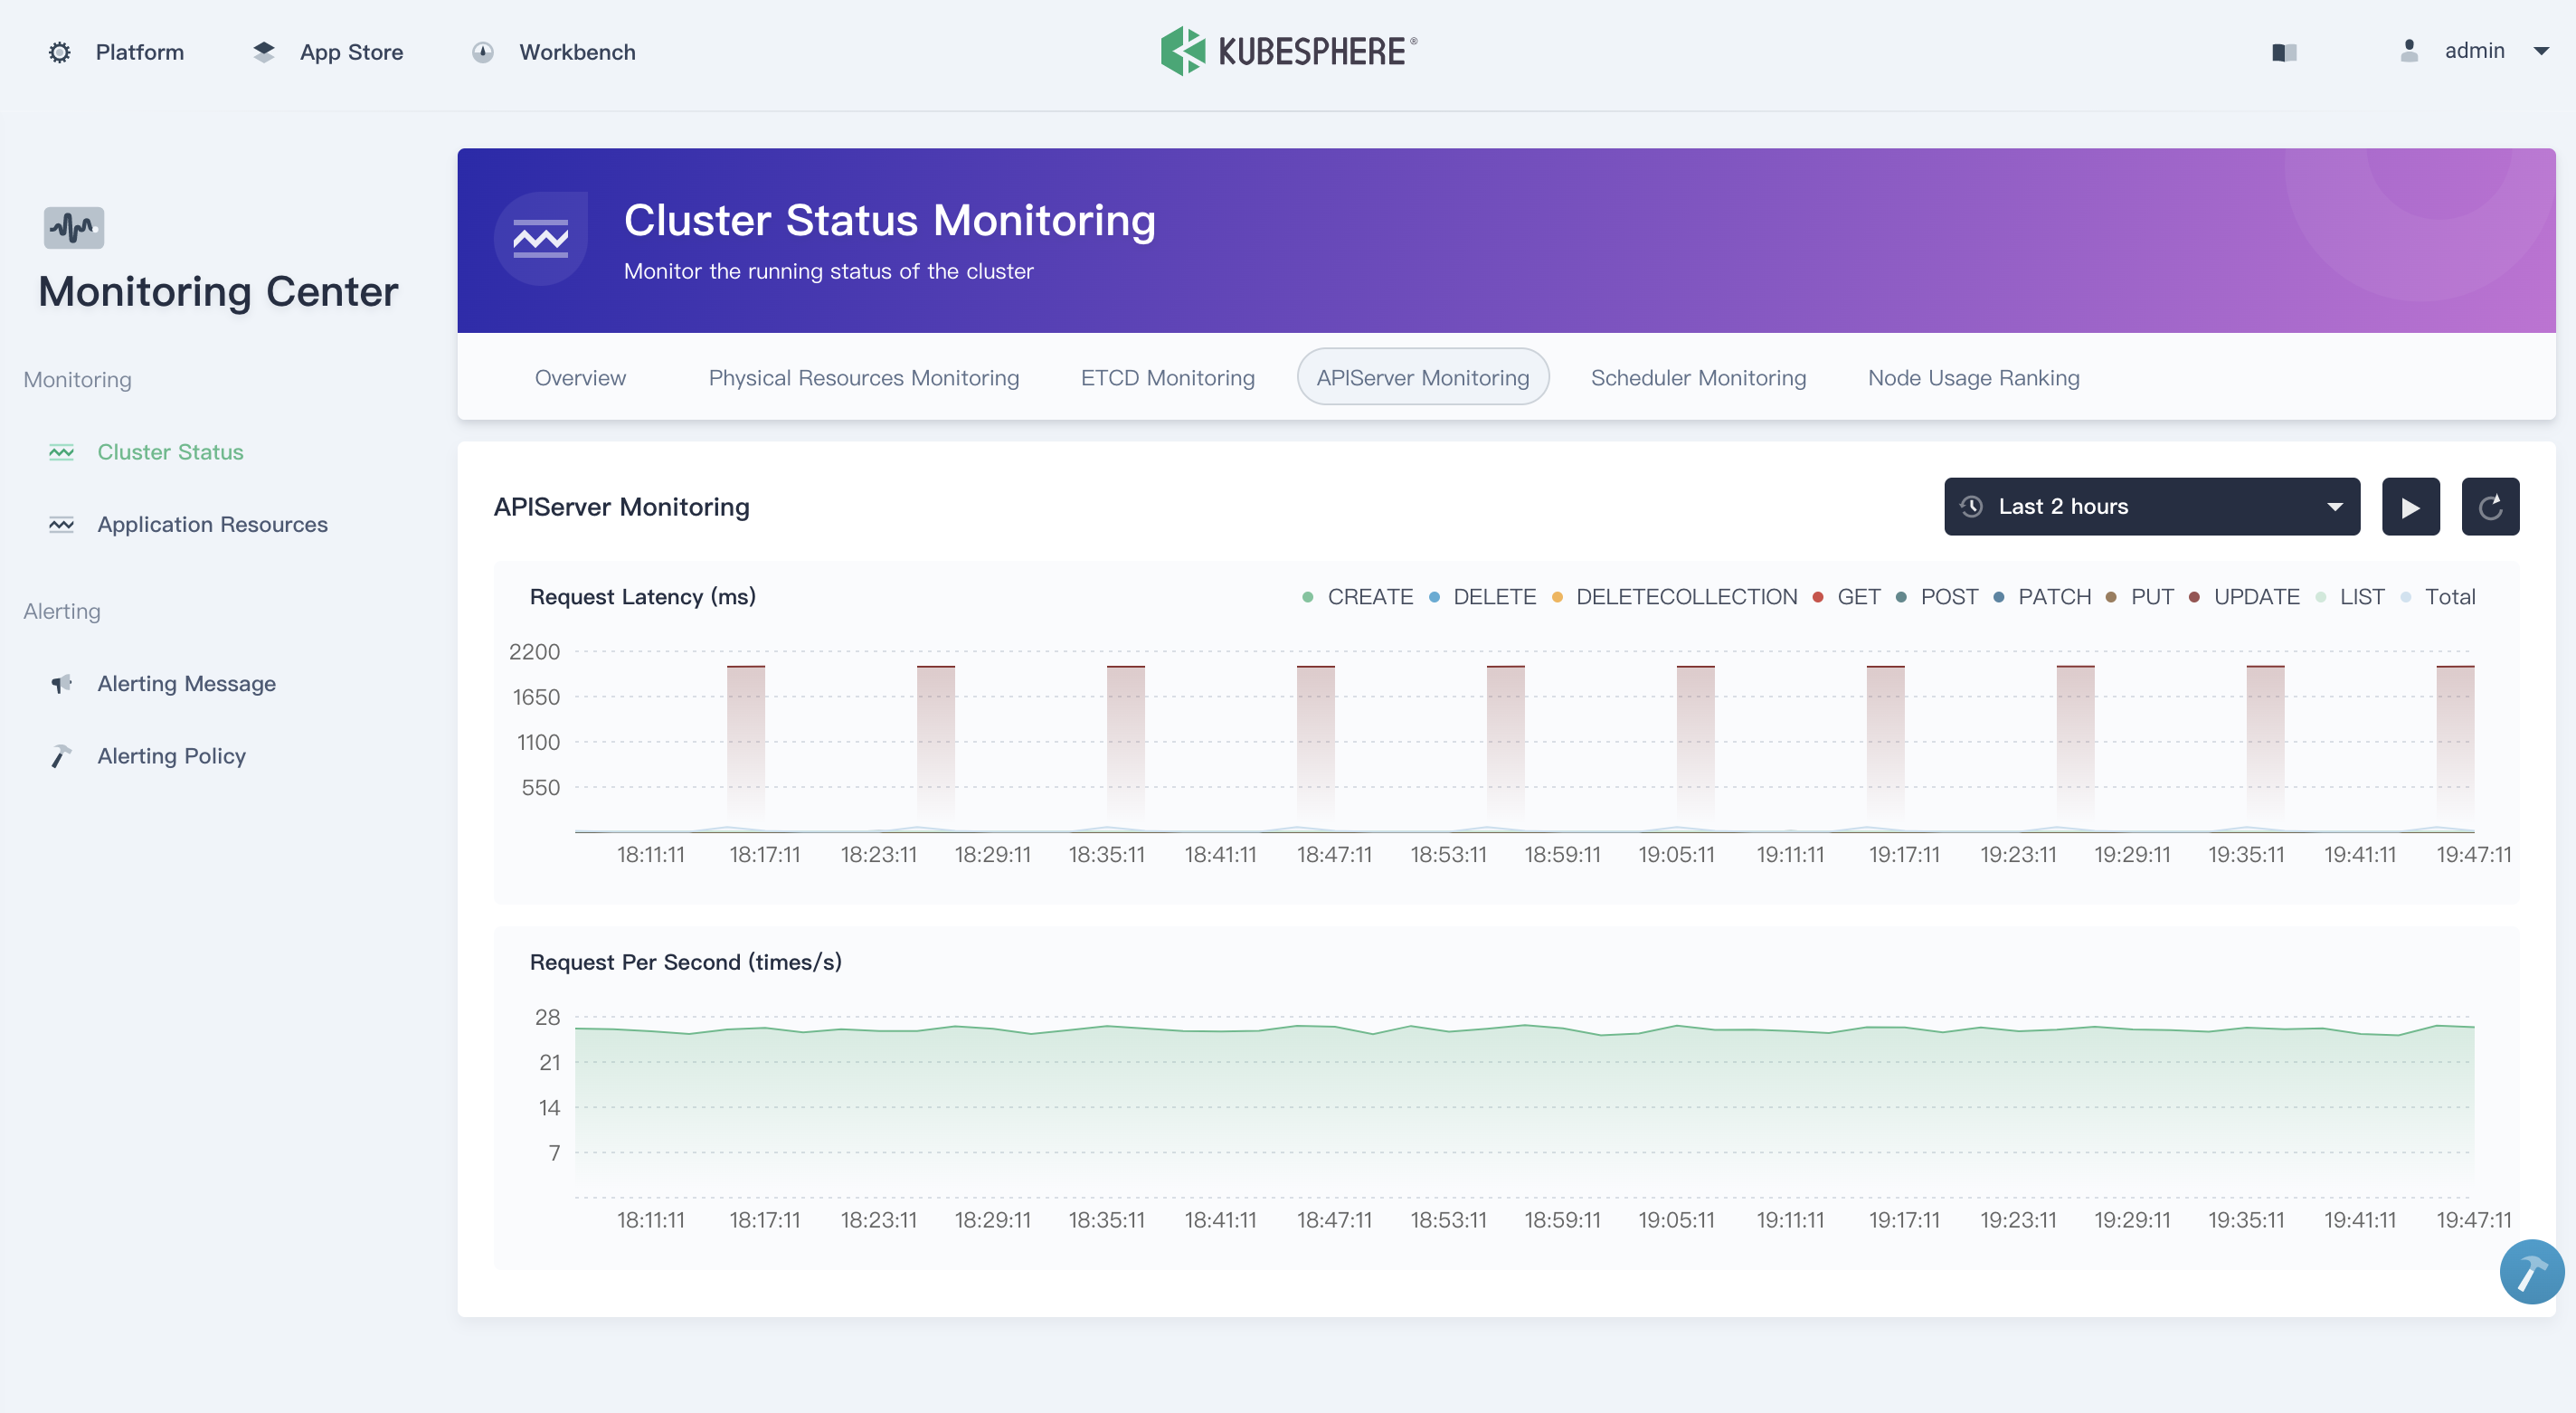
Key metrics of API Server
apiserver_request_by_verb_latencies(ms): Response latency distribution in microseconds for each verb, resource and subresource.apiserver_request_rate(times/s): Rate of apiserver requests
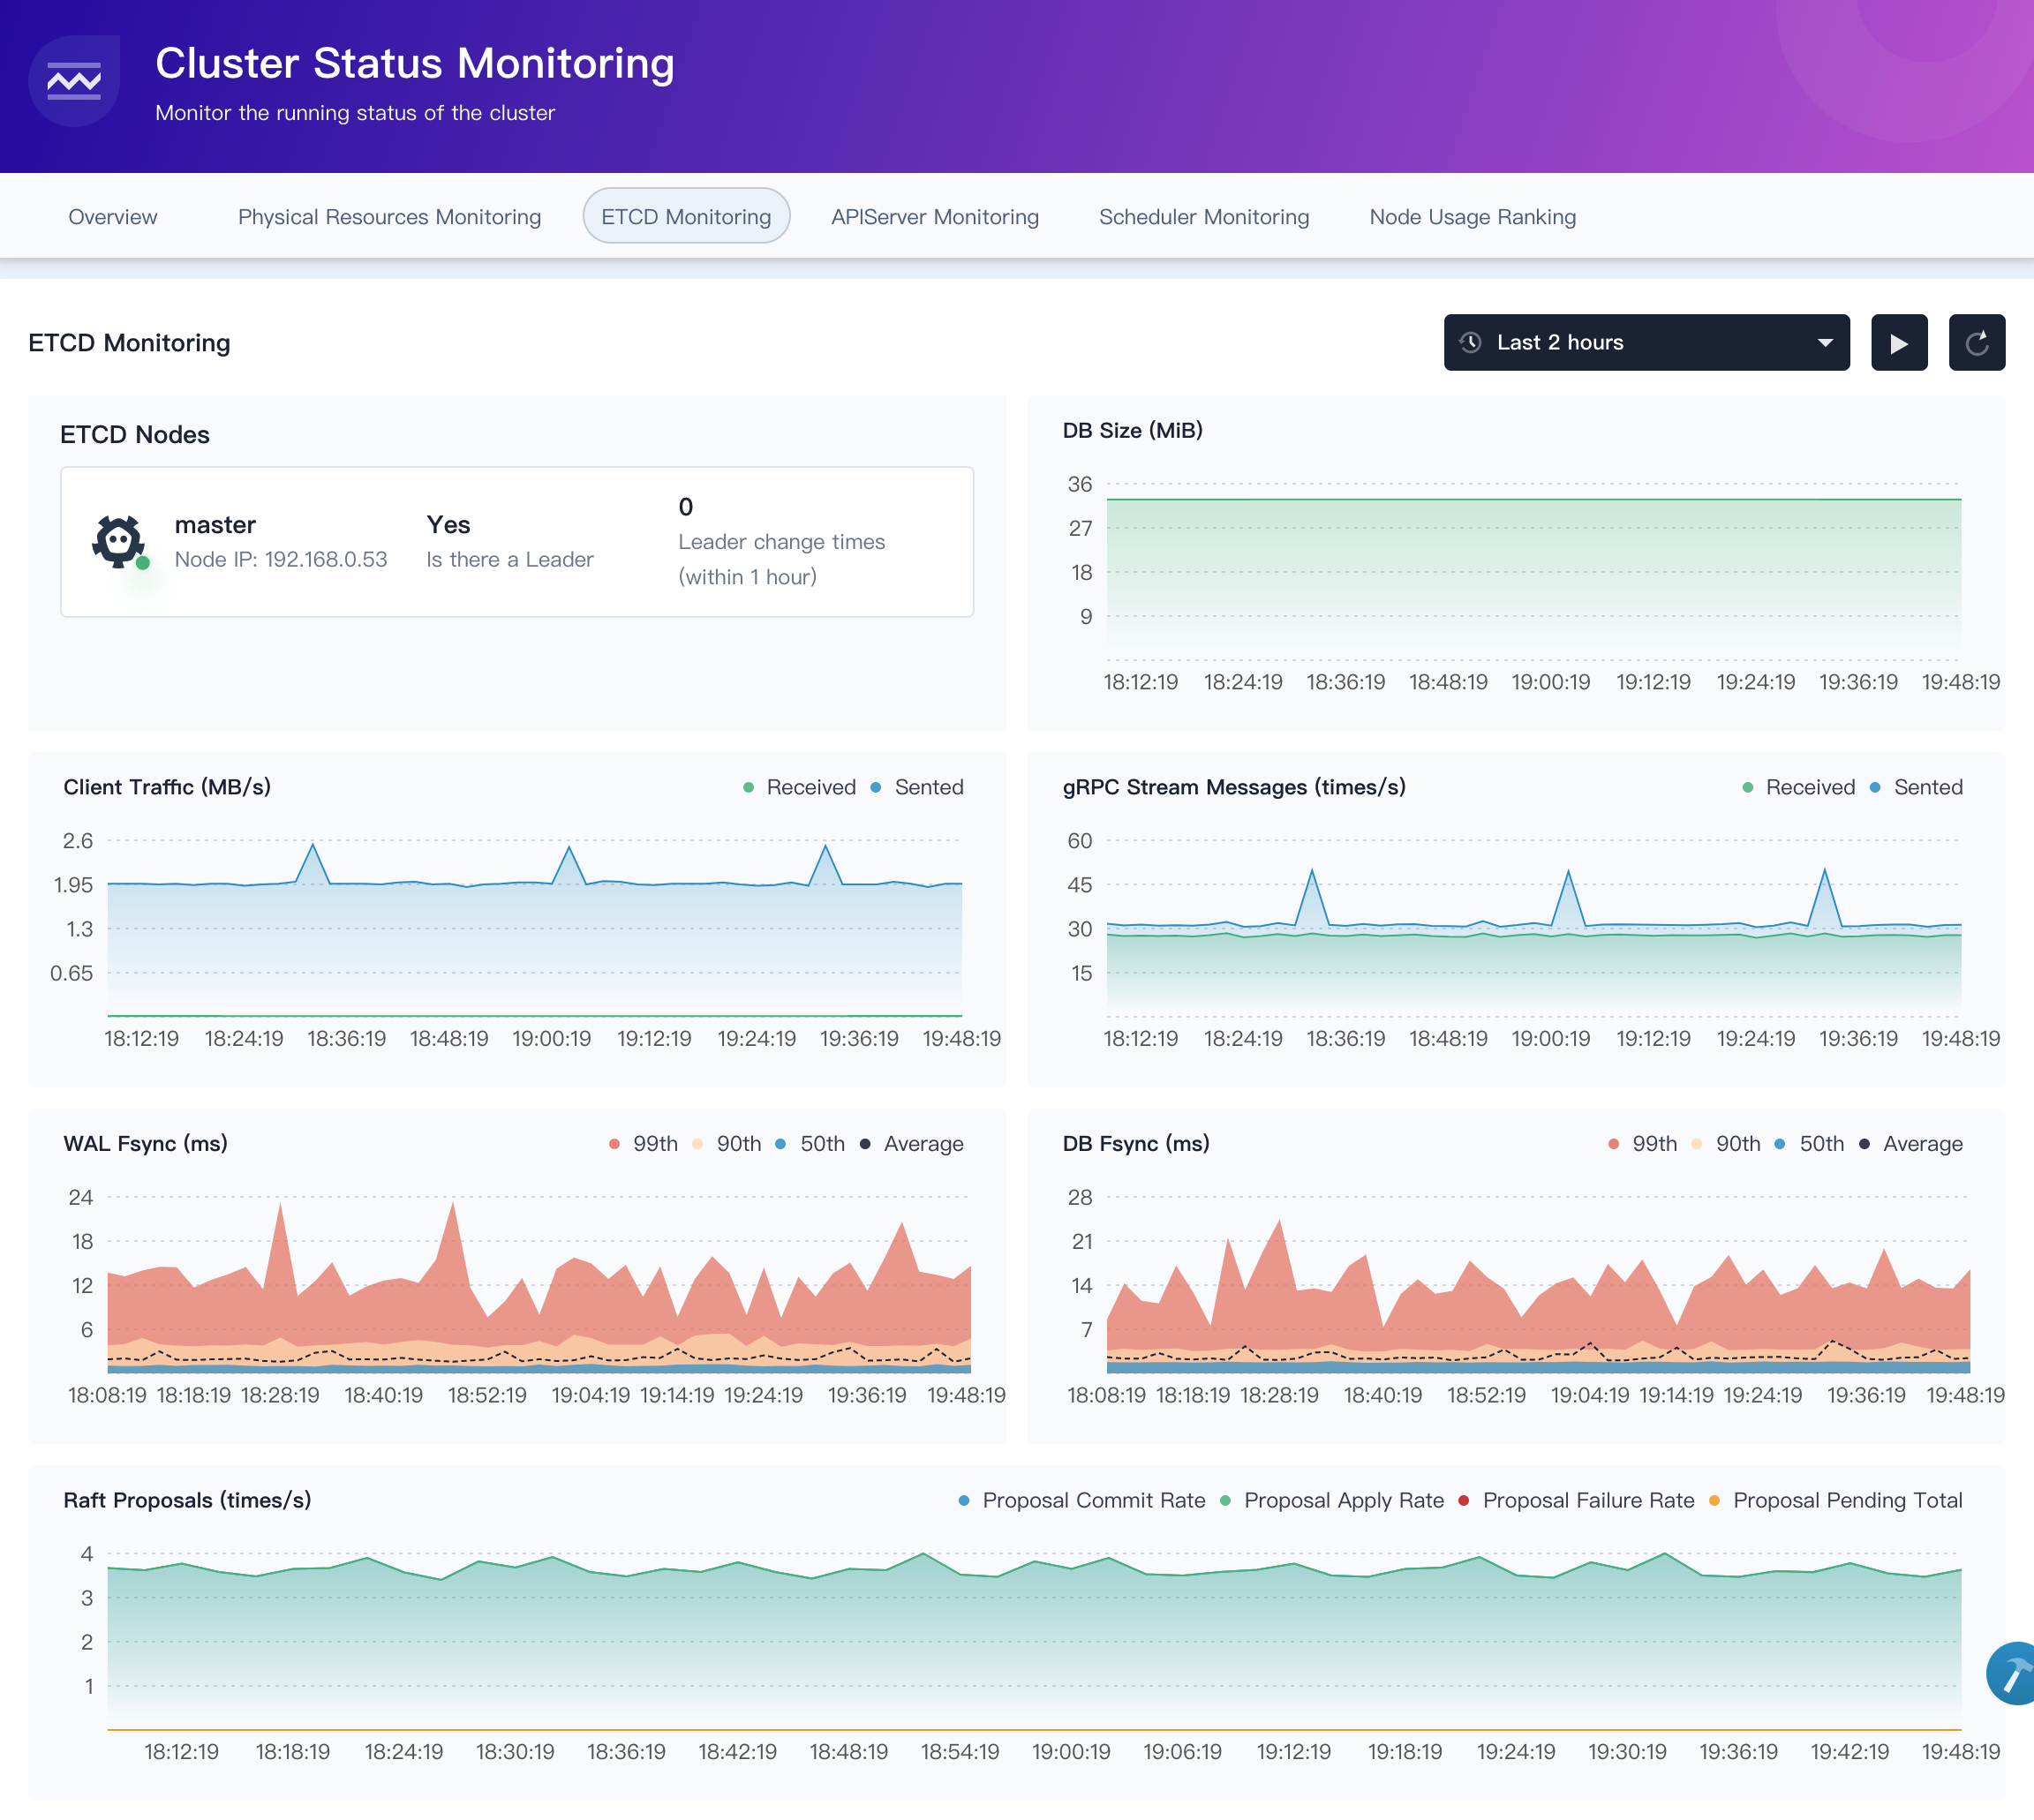
Key metrics of Etcd
has_leader: Whether or not a leader exists.etcd_mvcc_db_size(MiB): Total size of the underlying database in bytes.client_grpc_sent/received_bytes_total(MB/s): Including the total number of bytes sent and received to grpc clients.etcd_grpc_server_msg_sent/received_rate: Total number of gRPC stream messages received on and sent by the server.etcd_disk_wal_fsync_duration (ms): The latency distributions of fsync called by wal.etcd_disk_backend_commit_duration(ms): Describe your disk write performance.Raft Proposals(times/s): The raft protocol ensures that the proposals are applied correctly to the cluster, including metrics as follows:etcd_server_proposals_committed_totaletcd_server_proposals_applied_totaletcd_server_proposals_pendingetcd_server_proposals_failed_total
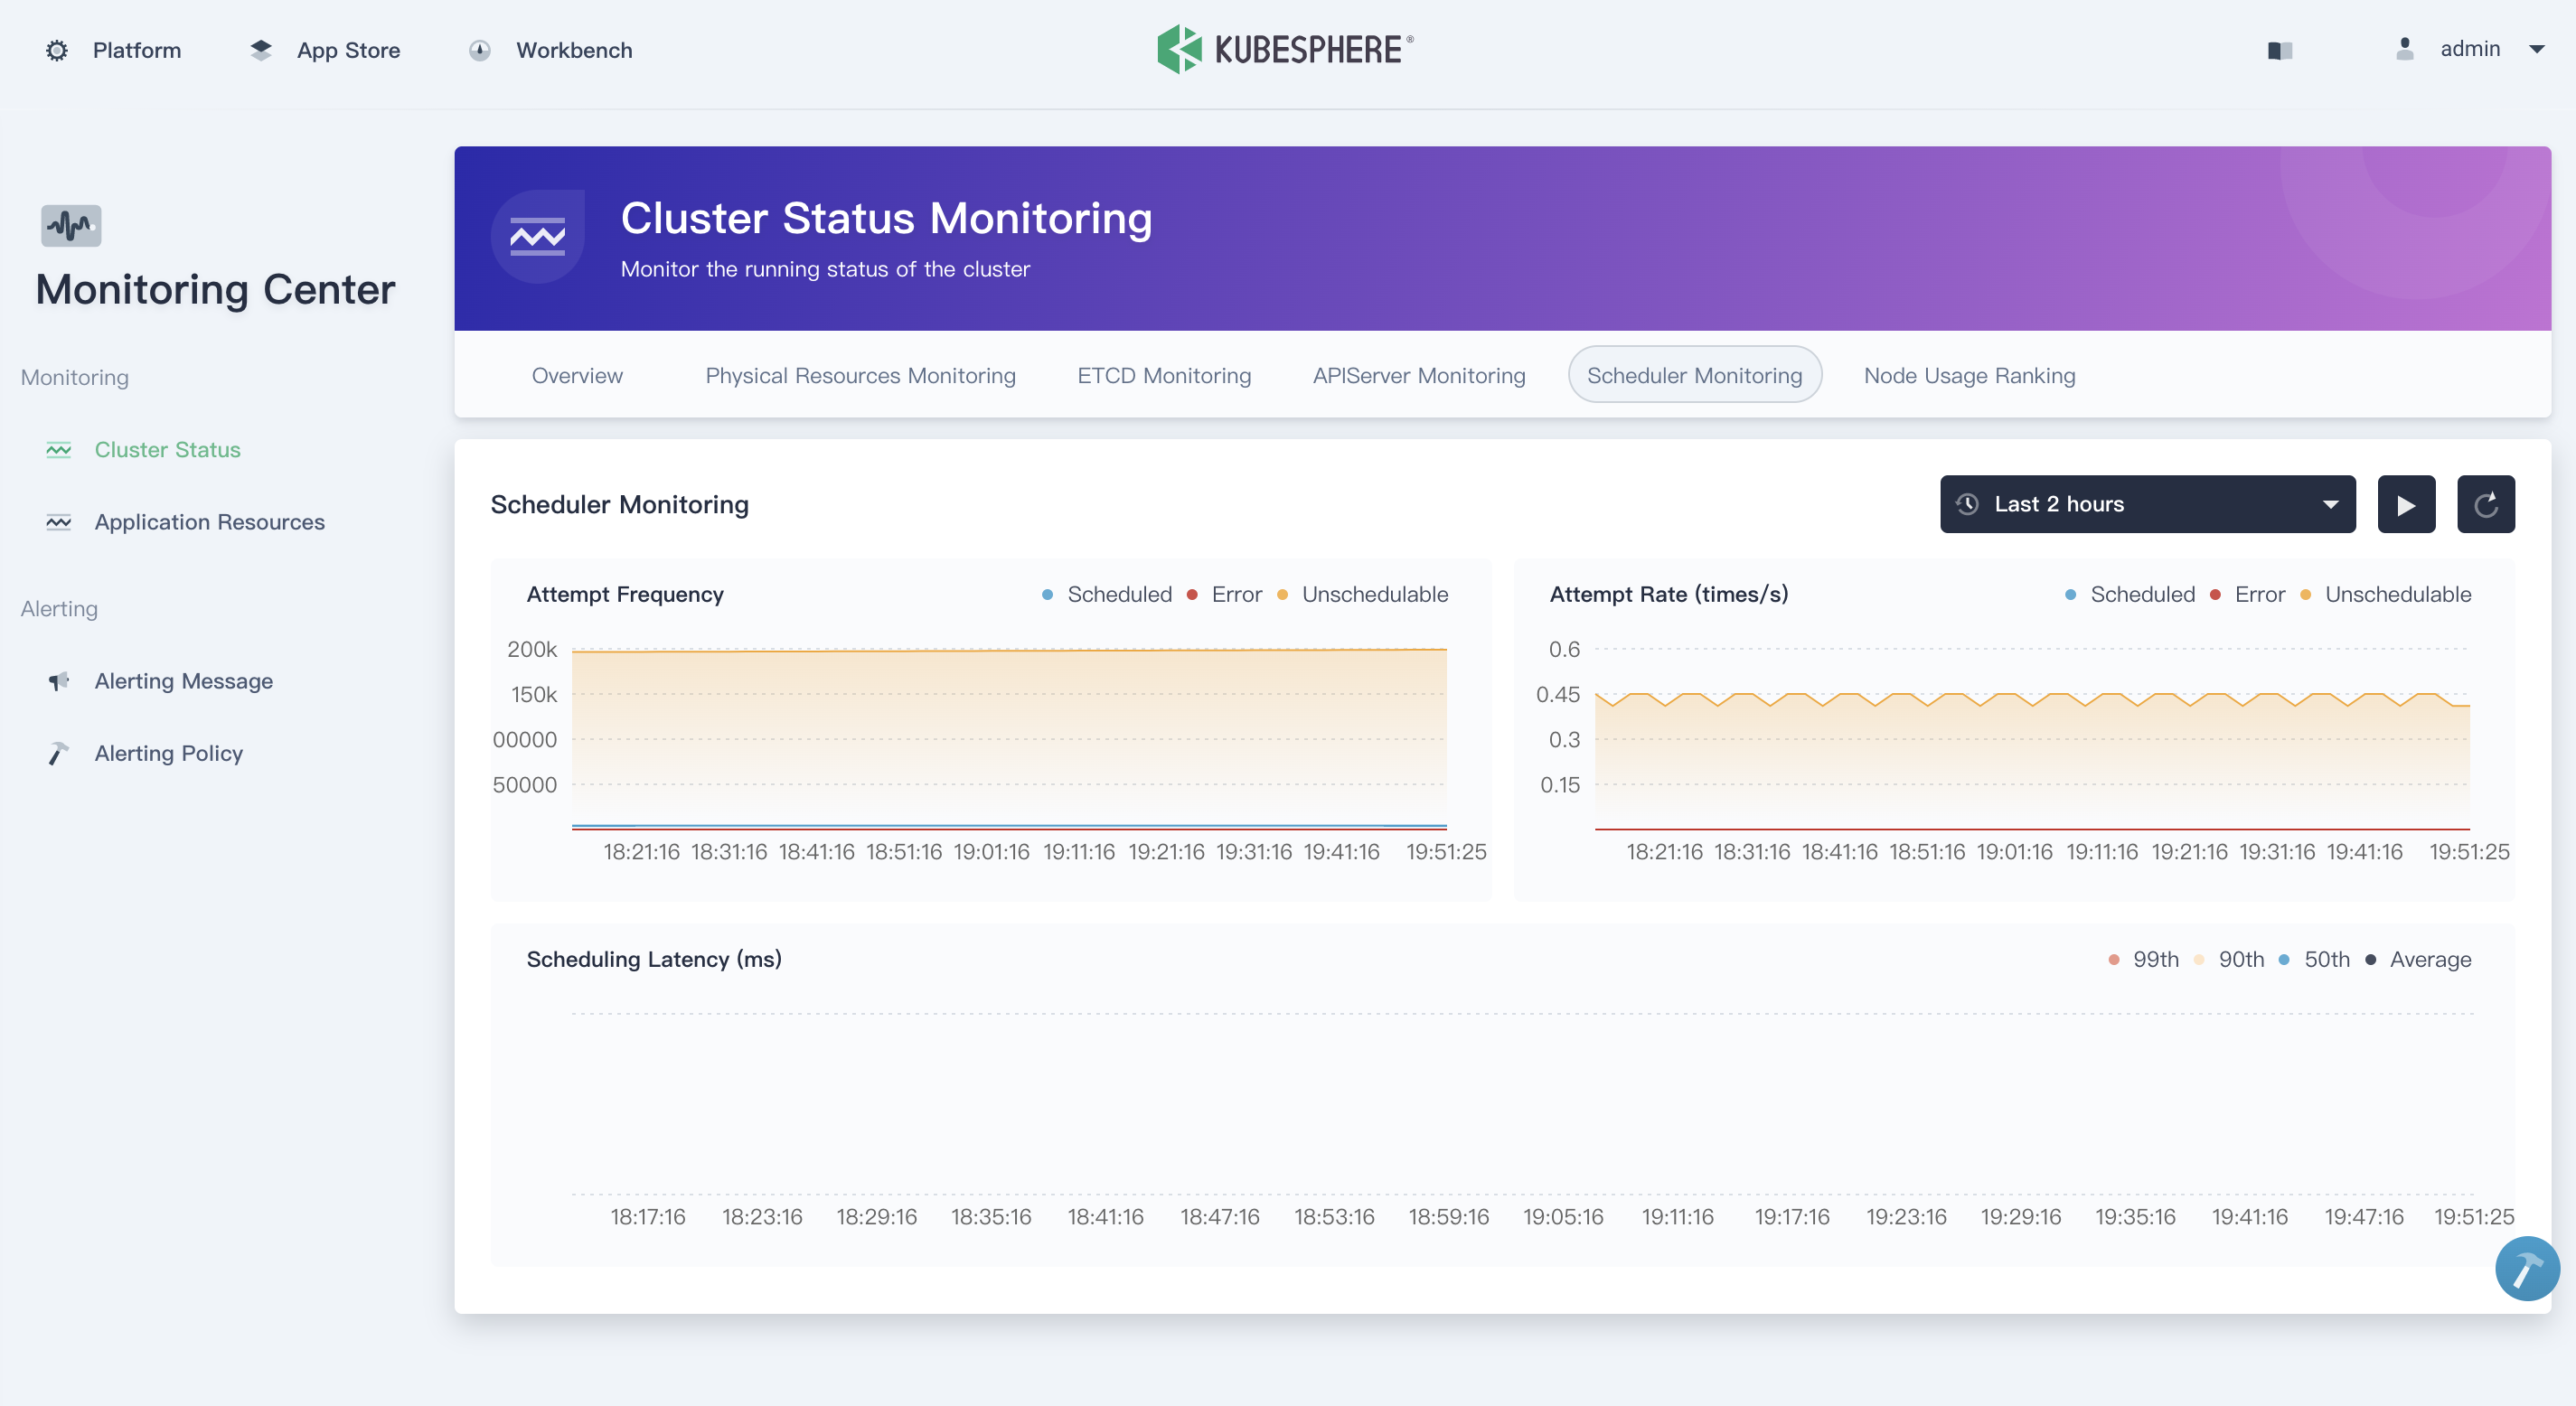
Key metrics of kube-scheduler
scheduler_schedule_attempts: Difference of the number of attempts to schedule pods, by the result. unschedulable means a pod could not be scheduled, while error means an internal scheduler problem.scheduler_schedule_attempt_rate: Rate of the number of attempts to schedule pods, by the result. unschedulable means a pod could not be scheduled, while error means an internal scheduler problem.scheduler_e2e_scheduling_latency: The end-to-end scheduling latency, which is the sum of the scheduling algorithm latency and the binding latency.
How to Install KubeSphere
KubeSphere is a distributed operating system providing cloud native stack with Kubernetes as its kernel, and offers rich observability from application to infrastructure. KubeSphere supports installing on cloud-hosted and on-premises Kubernetes cluster, or installing on Linux machines. This guide only walk you through the installation on existing Kubernetes cluster.
Prerequisites
Kubernetes version:1.15.x, 1.16.x, 1.17.xHelm version>=2.10.0and <3.0,see Install and Configure Helm in Kubernetes; KubeSphere 3.0 will support Helm 3.0.- A default Storage Class in your Kubernetes cluster is configured; use
kubectl get scto verify it. - Available resource CPU >= 1 Core and memory >= 2G
- The CSR signing feature is activated in kube-apiserver, see RKE installation issue.
Deploy KubeSphere
No internet access? Refer to Air-gapped Installation for instructions on how to use your own private registry to install KubeSphere.
Install KubeSphere using kubectl, assuming your cluster has internet access.
- If there are 1 Core and 2 GB RAM available in your cluster, use the command below to trigger a default minimal installation only:
kubectl apply -f https://raw.githubusercontent.com/kubesphere/ks-installer/master/kubesphere-minimal.yaml
- If there are 8 Cores and 16 GB RAM available in your cluster, use the command below to install a complete KubeSphere, i.e. with all components enabled:
kubectl apply -f https://raw.githubusercontent.com/kubesphere/ks-installer/master/kubesphere-complete-setup.yaml
Verify the real-time logs. When you see the following outputs, congratulation! You can access KubeSphere console in your browser now.
$ kubectl logs -n kubesphere-system $(kubectl get pod -n kubesphere-system -l app=ks-install -o jsonpath='{.items[0].metadata.name}') -f

#####################################################
###              Welcome to KubeSphere!           ###
#####################################################
Console: http://10.128.0.34:30880
Account: admin
Password: P@88w0rd

NOTE:Please modify the default password after login.
#####################################################